In order to convert the output voltage of the various sensors to physically meaningful quantities, various procedures must be employed. These range from the adjustments for spectral and angular instrument characteristics to calibration methods that involve cloud filtering and regression analysis. USDA UVMRP constantly examines these procedures with the goals of improved reliability, accuracy, and relevance to the user community. If you have any questions, please contact us.
Total horizontal and diffuse horizontal irradiance is measured by the MFRSR instrument as a voltage. The direct normal radiation response is determined by subtracting the diffuse radiation from the total, then dividing by the cosine of the solar zenith angle. The total value is recalculated as the sum of the bias-corrected diffuse and the calculated direct normal. The calibration process converts the instruments output voltage to irradiances (watts/m2 * nm).
Level 0 data is the millivolt values from the instruments.
Level 1 data is Level 0 data with correction procedures applied along with various range checks for quality control.
Level 2 data has more checks for quality using machine learning techniques along with some statistical analysis and visual examination.
Level 3 data is irradiances with calibration factors applied along with various other quality control procedures.
Correction Procedures – Level 1
Data Quality Process – Level 2
- nbb: no bias available for broadband; data are not bias corrected
- bg: electronic noise in the signal due to aging of the components or interference from adjacent instrumentation
- nbp: no bias available for PAR; data are not bias corrected
- pg: electronic noise in the signal due to aging of the components or interference from adjacent instrumentation
- bm: shadowband motion problem; only total irradiance available
- dr: diffuser is dirty; only in-situ calibrated irradiance should be used
- lv: voltage is low for channel #; irradiance may be digitized at the 3-minute time resolution
- vg: electronic noise in the signal due to aging of the components or interference from adjacent instrumentation
Calibration Procedures – Level 3
Site-specific Langley voltage intercepts are generated monthly using the theory briefly described under the Langley Calibration Method tab in this section. Bias and cosine corrected direct normal voltages, expressed as ln(mV), are regressed on airmass over a specific airmass range to determine the Langley voltage intercept value (V0). To ensure stable V0 values are obtained, variations in measured voltages due to clouds or atmosphere anomalies are removed using a two-standard deviation test. V0 values are then taken as the x-intercept (airmass=0) of the final regressions performed using data points that pass all criteria (e.g., cloud-free); the slope of the line is the average optical depth. Gaussian process regression with estimated dynamic input uncertainty is used to provide the smoothed daily V0.
Ideally, Langley's analysis of the MFRSR data would produce two intercept values (one for the morning, another for the afternoon) for each channel for each day of instrument operation. Also ideally, intercepts would be constant for each instrument as they represent the voltage that would be measured if the instrument was placed at the top of the atmosphere. In reality, neither of these conditions is met. The density of the intercept points varies greatly from site to site, being quite sparse at more turbid sites. Changes in both atmospheric conditions and instrument function can also result in significant variation and drift.
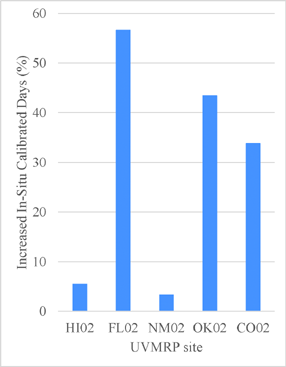
To maintain scientifically-credible calibration of the instruments, we have refined our in-situ Langley calibration techniques to include the application of a new robust cloud Gao. 2014. A new cloud screening algorithm for ground-based direct-beam solar radiation. Journal of Atmosphere and Oceanic Technology, 31(12), 2591-2605. doi: screening algorithm. The graph shows the number of increased days with the new algorithm. Notice the increase for the turbid site in Florida, along with smaller increases for the sunny dry sites in Hawaii and New Mexico.